
What the U.S. Disaster Risk Map Actually Tells You
7 min read
On this page
The National Risk Index is a useful first look, not a verdict on your house. Here’s how to read it without panicking—and what to check next.
You’re under contract on a house in Tulsa. The inspection report is clean. Then your insurance agent emails a quote that’s $1,200 higher than you expected and asks for a wind mitigation form. You pull up FEMA’s National Risk Index, type in the county, and see a color you don’t understand. That’s the moment this map is for.
The National Risk Index is not a score for your specific address. It’s a county-level comparison of 18 natural hazards across the United States. It can tell you whether your county faces more expected loss from tornadoes, river flooding, or wildfire than most places. It cannot tell you whether the creek behind your new house will top its banks. That depends on your parcel, your drainage, and the storm.
Here’s the practical way to use it: treat the map as a list of questions, not an answer. Then go find the local map that does cover your address. FEMA’s flood maps, your state forestry wildfire map, USGS earthquake shaking maps, and NOAA’s storm outlooks are where the real decisions live.
The map is a first date, not a marriage

FEMA’s National Risk Index combines three big things: expected annual loss, social vulnerability, and community resilience. Expected annual loss is what it sounds like—how much damage a hazard typically causes in a county in a year, on average. Social vulnerability looks at how hard it might be for people in that county to recover. Community resilience looks at local capacity: planning, codes, emergency services.
So the colors are not just about weather. A county with frequent hurricanes but strong building codes and good evacuation routes may score differently than a county with weaker systems. That’s useful context. It’s also why a “low” risk color doesn’t mean your insurance will be cheap or your roof will survive.
What the colors actually compare
When you open the National Risk Index, you’ll see a default national view. It ranks counties relative to each other. A dark red county is in the highest risk category compared to the rest of the country. A pale county is lower. But “lower” is a relative word. A pale county in California can still have a serious earthquake problem.
Click into your county and look at the hazard list. You’ll see separate scores for things like avalanche, coastal flooding, cold wave, drought, earthquake, hail, heat wave, hurricane, ice storm, landslide, lightning, riverine flooding, strong wind, tornado, tsunami, volcanic activity, wildfire, and winter weather. Not every hazard matters everywhere. That’s the point.
If you see heat wave and drought near the top, for example, you’re looking at a different prep list than someone in Miami-Dade seeing hurricane and coastal flooding. Neither list is better or worse. They’re just different Tuesdays.
Your address can beat your county
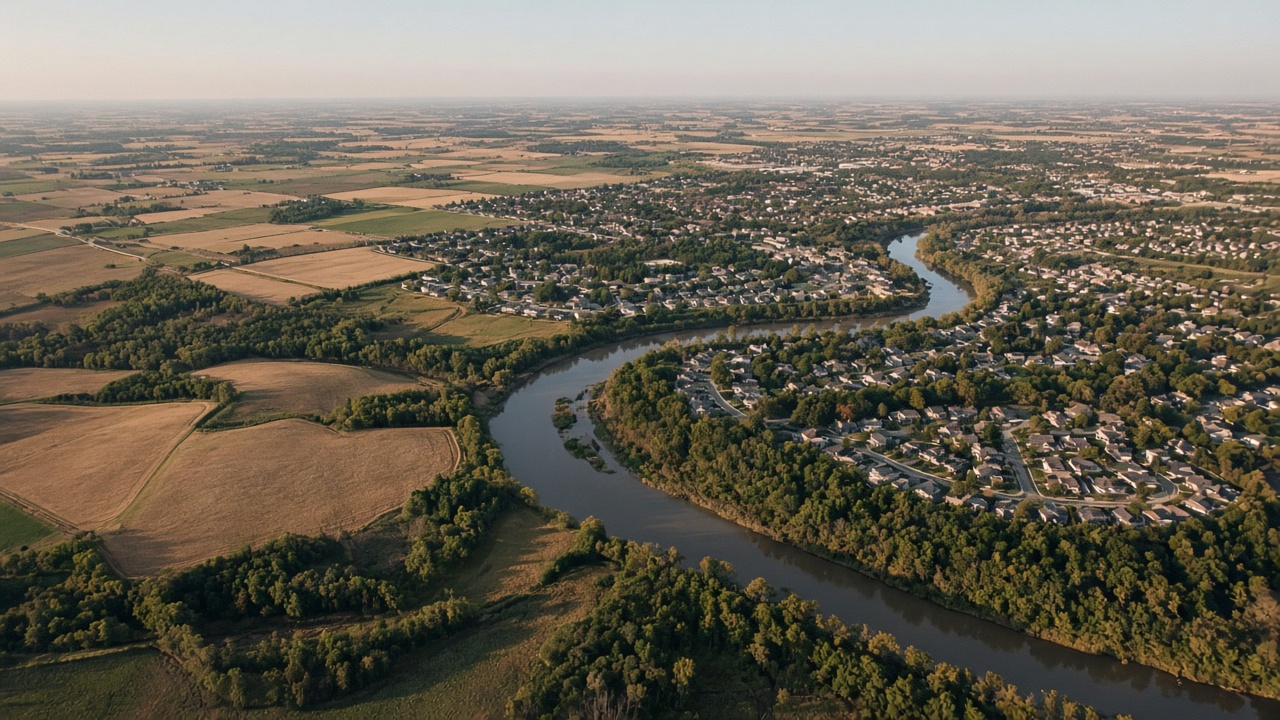
Counties are big. A county risk score is an average across cities, farmland, mountains, and coast. Your specific block can be much safer or much more exposed.
Say you’re looking at a house in Sacramento. The county may have a moderate overall score, but your street could sit in a FEMA special flood hazard area near the American River. Or you could be on a ridge with wildfire exposure that the county average washes out.
This is where local maps matter:
- Flood: FEMA’s Flood Map Service Center shows your official flood zone. FloodSmart explains what the zones mean and what NFIP coverage does.
- Wildfire: Your state forestry or fire agency often has a parcel-level wildfire hazard map. FEMA and Ready.gov have general prep steps.
- Earthquake: USGS earthquake hazard maps show shaking potential by location. They are not a prediction of when, just where shaking is more likely to be strong.
- Hurricane and wind: NOAA’s National Hurricane Center tracks storms and storm surge. Your county emergency management office usually has evacuation zones.
- Drought and heat: The U.S. Drought Monitor shows current drought conditions. CDC has heat safety guidance.
Flood: the hazard that follows the house
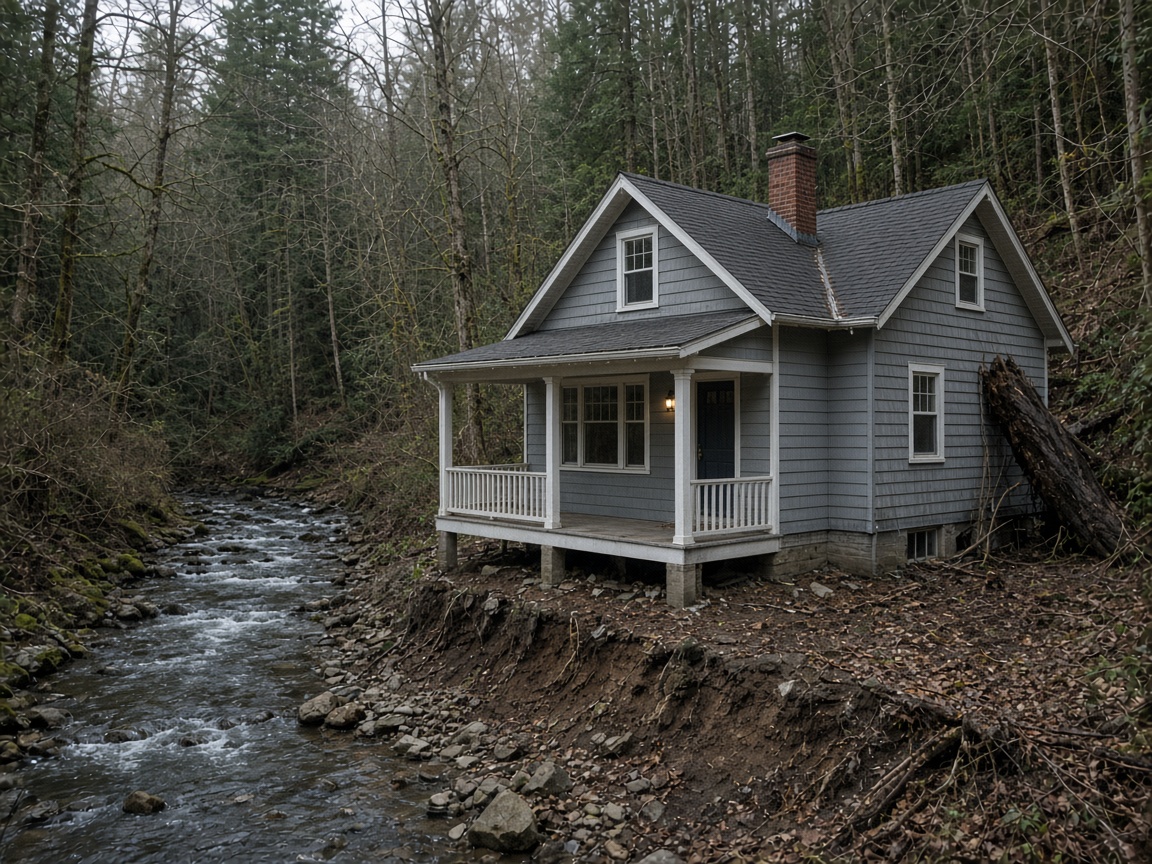
Flood is the one people misunderstand most. You don’t need to live on a coast. You don’t need to live near a river. Heavy rain, poor drainage, and a rising creek can put water in a house that nobody labeled a flood zone.
FEMA flood maps are the official basis for mortgage lenders and the National Flood Insurance Program. If you’re buying, your lender will likely check whether you’re in a high-risk zone. But the map is not a guarantee. Flood zones change. Development changes drainage. And roughly—I’m being qualitative here—many flood claims come from areas outside the highest-risk zones.
So if the seller says “you don’t need flood insurance,” get the elevation certificate if one exists. Ask the neighbors if the street has ever taken on water. Then call an insurance agent who writes NFIP policies and private flood policies. Compare.
Wind, wildfire, earthquake: read the right map
Different hazards need different maps because they behave differently.
Wind and hurricanes: NOAA’s National Hurricane Center issues forecasts, surge maps, and wind speed probabilities. For a house in Tampa or Charleston, the county risk index is a starting point, but the real question is whether your roof, windows, and garage door meet current wind standards. A wind mitigation inspection can lower premiums and tell you what to fix.
Wildfire: A county may be low risk overall, but your house can sit in a canyon with one road out. Look at state wildfire maps, local firewise programs, and your own defensible space. FEMA and Ready.gov have clear checklists for vegetation, vents, and evacuation kits.
Earthquake: USGS shaking maps are the standard. They show the likelihood of strong shaking over long time frames. For a house in Seattle or Los Angeles, the retrofit question—bolting the frame to the foundation, bracing water heaters—matters more than the county color.
Tornado and severe storms: NOAA’s Storm Prediction Center has outlooks and risk categories. If you’re in Oklahoma or Alabama, a safe room or a reinforced interior room is worth talking about before you sign.
If you only do one thing
If you only do one thing, go to FEMA’s National Risk Index, find your county, and write down the top three hazards. Not the color. The hazards. Then spend one afternoon matching each one to a local source: your flood zone from FEMA, your wildfire risk from the state, your earthquake shaking from USGS. That’s your real risk profile. It takes less time than arguing with an insurance quote.
Questions we get
Does a low-risk county mean my insurance will be cheap?
No. Insurance rates depend on your specific address, construction, claims history, and the company’s own models. A low county score may help, but a single flood zone designation or a roof age can change the quote more. Always get quotes before your inspection period ends.
Should I trust the national map over my realtor?
Trust it as a conversation starter. Your realtor knows the market and the neighborhood. The map knows the county-level hazard history. Neither replaces the local flood map, the elevation certificate, or a conversation with neighbors who have lived through a storm.
What if the map says my area is high risk?
High risk doesn’t mean uninsurable or unlivable. It means you need to plan. Get the right coverage, retrofit what you can, and know your evacuation route. Plenty of people live safely in high-risk places because they took the hazard seriously.
Official sources
- FEMA National Risk Index
- FEMA Flood Map Service Center
- FloodSmart (NFIP)
- Ready.gov
- NOAA National Hurricane Center
- NOAA Storm Prediction Center
- USGS Earthquake Hazards Program
- U.S. Drought Monitor
- CDC Heat and Health
- FEMA Wildfire Risk Management
Start with the county map, then zoom in until you’re looking at your own street. The national picture is useful. The local one is what you’ll live with.
About our guidance
Our guides are grounded in publicly available information from official sources such as FEMA, NOAA, USGS and Ready.gov. Information is general in nature — always verify details for your specific property and policy with official sources and your insurer.
Related guides
 PreparednessSafest States from Natural Disasters? Check the Address FirstThere's no state where you can skip the flood map. But some states do have fewer overlapping hazards, and FEMA's county-level…Oct 9, 2026Read guide →
 InsuranceLender-Placed Flood Insurance: The Expensive Backup If Your Policy LapsesYour lender can force-place flood insurance if your policy lapses — and bill you for it, usually at a higher price. Here is how…Oct 15, 2026Read guide →
 InsuranceWhat Happens to Your NFIP Policy If Congress Lets the Program LapseCongress extended the NFIP through December 11, 2026. If the program lapses, existing policies stay in force and claims get paid…Oct 15, 2026Read guide →